Does geographic location confer competitive advantage in the R01 rat race? Symbiotic relationships often develop between geographically clustered firms with related goals and interests, and this results in enhanced productivity and output for each. It is well known for medical scientific research that the Boston and San Francisco areas are each home to some of the most prolific universities and research centers in the US. In current times when the competition for grants has never been so fierce, it is all the more important to understand what factors contribute to the success of principal investigators.
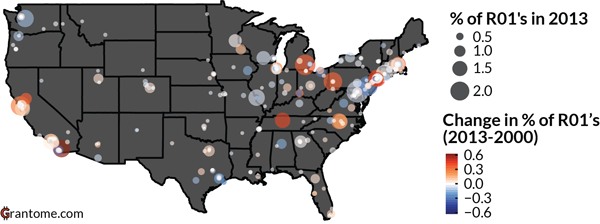
Continuing on our previous analysis, we calculated the change in the fraction of the grant pool held by each institution between 2000 and 2013. The results are shown in the context of the map of the US, where each institution is represented as a point according to its location. The size of the point is proportional to the fraction of the R01 grant pool it had in 2013, and the color represents the change between 2000 and 2013. Red/orange indicates that the school has secured a larger fraction of the total number of grants in 2013, while blue means it has dropped.
It is clear that many of the most competitive universities and institutions – which have a large and ever increasing amount of the grant pool, represented by the largest diameter points and colored by the deepest red hues – are clustered in Boston, New York City, San Francisco, and San Diego. There are also clusters of highly competitive institutions in the North Carolina research triangle, Pittsburgh, and near Ann Arbor, Michigan. It is intriguing that Vanderbilt University in Nashville, Tennessee has independently expanded to be a strong, independent research center. There are many institutions in Florida that, while not located in as close proximity to each other as other institutions in the northeast or west cost, are all nonetheless all “in the red.”

We also analyzed the locations of institutions that are losing their share of the R01 grant pool, represented by small diameter points and colored in blue. These institutions and universities are located in the Midwest in upstate New York, Ohio, and Wisconsin, as well as in the Northwest in Washington and Oregon. There are also many institutions “in the blue” in the center of the country in Illinois, Iowa, Missouri, Texas, and Colorado.

We calculated for each state the overall change in the number of R01 grants between 2000 and 2013, summed over all institutions. California did the best, with its institutions together receiving 1.7% ($253 million) more of the grant pool. For the 10 California schools that secure the most R01 grants, Scripps Research Institute is the only one in the blue, and their locations are clustered near the state's largest cities. This net gain for California is 4-fold greater than those obtained by institutions in North Carolina, Florida, Tennessee, and Pennsylvania. The states that lost the most were Texas and New Jersey, with its institutions collectively losing 0.61 ($91 million) and 0.56% ($83 million) of the grant pool, respectively.
Location surely has something to do with the mutual success of institutions that are located in close proximity, as well as the decline of institutions that are fairly isolated. The former is exemplified by institutions in the California cities, while examples of the latter are found throughout the midwest, northwest, and central parts of the country. Yet there are notable outliers to this behavior. For example, despite the large number of institutions in New Jersey and Philadelphia, they have experienced a net decline. Also, Vanderbilt University has grown strongly despite being largely isolated.
Is your region of the country doing as you would expect?