The gap between the rich and the poor is widening in the general population. Similarly, we wanted to determine if the richest R01-funded institutions have the fastest and most favorable rates of expansion. For each institution we calculated what fraction it obtained of the total number of R01 grants that were awarded in 2013, as well as the average rate of change in that fraction per year. The reported rates of change are average values calculated over the 3 year period between 2010 to 2013. The results are shown on the plot above, where the fraction held in 2013 is plotted on the y-axis, and the growth rate on the x-axis. Orange colored points correspond to the 24 institutions that have the largest fraction, each securing at least 1% of the grant pool, while grey colored points correspond to the next 76, with 0.16-1.00%. The institutions with the largest, most favorable growth rates of more than +0.03% are "orange" colored points, belonging to the group institutions with the largest fraction of the 2013 R01 grant pool. Of the $14.9 billion dollars that NIH allocated to active R01 grants in 2013, 0.03% corresponds an extra $4.9 million per year, with the largest change of 0.086% resulting in an extra $12.8 million per year. Inspection of the plot reveals general correlation between growth rate and number of R01 grants, with a correlation coefficient of 0.5 and p-value of 2e-7.

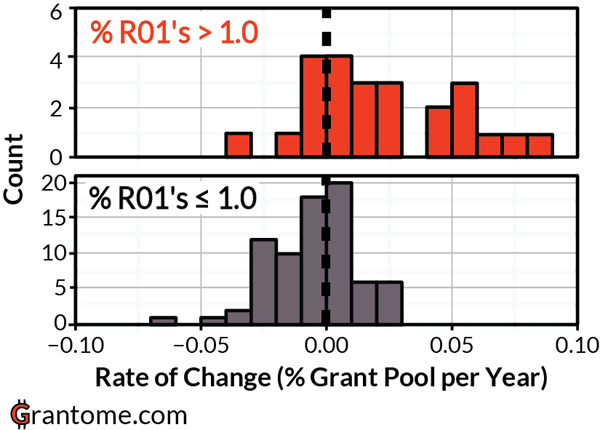
For the institutions with at least 1% of the 2013 grant pool, the vast majority are growing, obtaining increasing fractions of the R01 grant pool. This is evident from a histogram of the number of institutions with various growth rates, which is displayed as the upper, orange-colored graph on the above figure. It is clear that the distribution is skewed towards positive growth rates. In contrast, institutions with less than 1% of the 2013 grant pool are as likely to be expanding as they are contracting, with positive or negative rates of growth, respectively. In this case the distribution is centered at 0 growth rate, as shown on the lower histogram in grey.
Is there growing inequality among institutions with R01-funded grant programs, with the winners "taking it all"? What do you think?