The R01 is of indisputable importance to supporting medical research. Statistics from the NIH data book report that $14.9 billion dollars were awarded to R01 type research project grants in 2013. R01 grants support virtually all costs associated with medically relevant research projects that are conducted over a 3-5 year timeframe. For many competitive research laboratories, R01 grants, with an average size of over $400,000 in 2013, are the major source of financial support for both personnel and research expenses. Also, the ability to obtain and renew such grants is arguably the most important factor in performance assessments of research-oriented faculty positions within universities and medical institutions. Given the importance of the R01 grant to medical research and the careers of scientists, it is essential to identify trends and factors that affect how the grants are awarded and distributed.

The size of the R01 grant pool has grown and fluctuated widely over the last 27 years for which data are available. Not surprisingly, the changes in the total number of R01 grants awarded each year (see above or click here) parallels overall NIH budget trends. There was a steady increase in the number of grants while the budget was doubling between 1999 and 2003. This was followed by a period with flat to declining budgets and number of grants between 2004 to 2008; a sudden jump in 2009 when the American Recovery and Reinvestment Act provided a one-time budget increase; and more years of flat to declining budgets and number of grants from 2010 to 2013.
For the majority of R01-funded institutions, the number of active grants it has in any given year follows a trend that parallels the size of the grant pool, (see above or click here for the example of Johns Hopkins University). We decided to instead analyze the fraction or percent of the grant pool that each institution has obtained in any given year, since this is a measure of how competitive it is at obtaining funding.
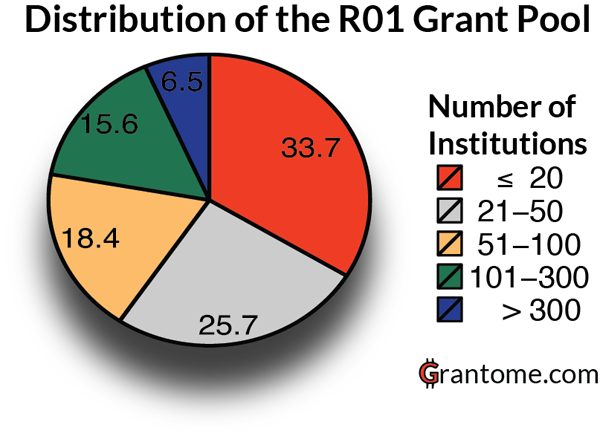
Initially we calculated this fraction for the each R01-receiving institution in 2013. Johns Hopkins is the well-established leader, holding strong with 2.4% of the R01 grant pool ($252 million dollars from R01’s alone in 2013). Further analysis reveals that the majority of the grant pool is distributed to only a few dozen institutions. 20 institutions collectively held 33% of the grants (i.e. $4.9 million), and 100 held 75% ($11.2 million). The NIH website reports that more than 80% of its budget goes to over 2,500 universities and research institutions. Yet for the R01 – which is arguably the most sought-after, prestigious grant that is the financial staple of many medically oriented research laboratories in the U.S. – the bulk of the grants are distributed to 4% of these 2,500 institutions. It therefore appears that the division of R01 grants among institutions parallels that of wealth among individuals in the U.S. population. It is highly unequal, with the bulk of the pool held by a lucky few.
Was this your impression of the R01 grant distribution?